- I have a cron-driven morning dashboard that stitches numbers from about 11 sources into one HTML file I open with my coffee.
- One morning it rendered completely empty. Every tile said "unavailable", every number was zero.
- Root cause: my
run.shonly called the renderer. It never re-ran the collectors. Data quietly went stale past the 36h threshold and the whole thing flipped to blank in one go. - The fix is a pattern worth stealing. Collectors write JSON to a dropbox folder, the orchestrator only reads, and stale entries degrade to "unavailable" badges instead of crashing the report.
- Result: any single collector can break, time out, or get rate-limited and the dashboard still renders the other ten.
I woke up, poured coffee, opened the tab I open every morning, and the dashboard was empty. Zeroes everywhere. Every tile said "unavailable". First thought: the internet is broken. Second thought: one of my servers died overnight. Third thought (the correct one): I wrote the cron script wrong. Spectacularly wrong.
This post is about what a self-healing morning dashboard actually looks like, why mine wasn't one, and the simple pattern I wish I'd used from day one. If you're an indie hacker or solo dev who wants a daily summary of your own metrics without paying for Retool, Metabase, or some SaaS you'll forget to cancel, steal this.
Why I Built a Morning Dashboard in the First Place
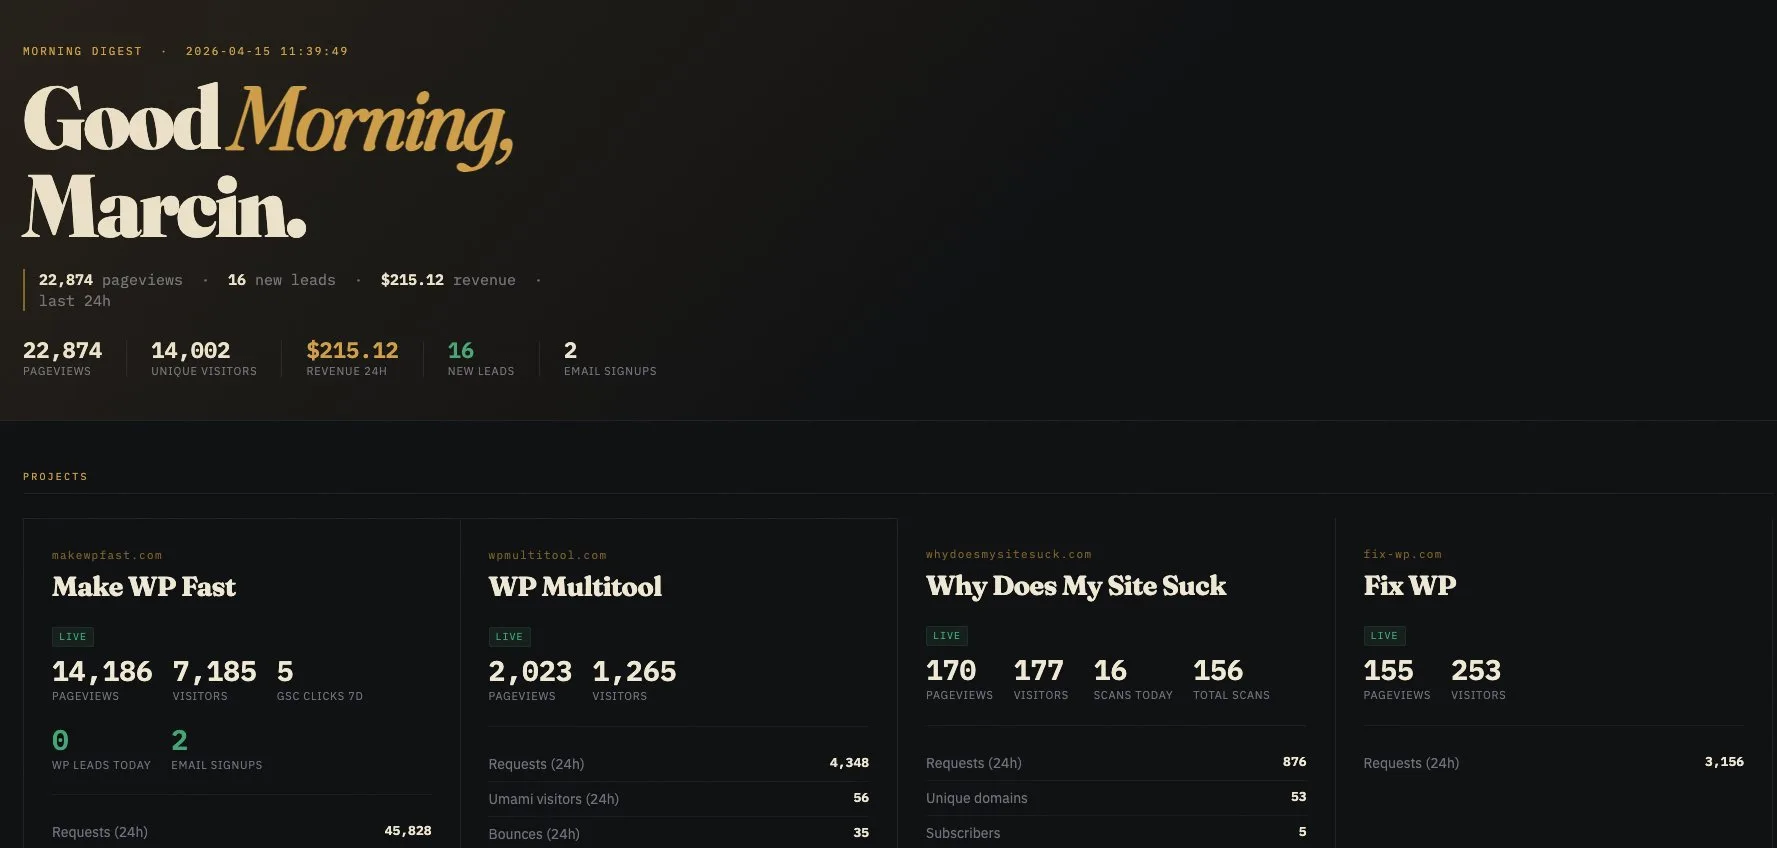
I run a handful of small products and side projects. WordPress plugins, a couple of SaaS tools, a personal blog, some GitHub repos, a Reddit account I post from, the usual. Each one has its own dashboard somewhere. Cloudflare has traffic. Umami has analytics. Polar.sh has revenue. Brevo has email signups. Google Search Console has clicks. GitHub has stars. And so on.
The problem is obvious. I'm not going to open eleven tabs every morning. And I'm definitely not paying $50/month for a dashboard SaaS to show me that zero people bought anything yesterday. What I wanted was one static HTML file that opens automatically at 8am with all the numbers I care about on one page.
So I built one. Python, Jinja2 template, cron entry, open -a at the end to pop it in the browser. The whole thing is maybe 700 lines across 11 collector scripts and an orchestrator. It took a weekend. I called it "morning digest" and wired it up to spit out to ~/reports/morning-latest.html every day at 08:00.
For a few weeks it worked beautifully. Then it didn't.
The Day It Went Blank
The failure mode was beautiful in how quiet it was. No error. No stack trace. No 500 page. The HTML file existed, timestamped that morning, 26 KB, perfectly valid. The browser happily rendered it. It just had no numbers in it.
Every section said "unavailable". Every card was empty. The header still said "Good morning, Marcin" and the date was right. The shell of the page was fine. The data was gone.
I checked the cron log and there it was, eleven times in a row:
INFO Section cloudflare  state=unavailable  stale (42.2h old, limit 36h)
INFO Section umami       state=unavailable  stale (43.0h old, limit 36h)
INFO Section revenue     state=unavailable  stale (43.0h old, limit 36h)
INFO Section github      state=unavailable  stale (43.0h old, limit 36h)
INFO Section reddit      state=unavailable  stale (43.0h old, limit 36h)
INFO Section leads       state=unavailable  stale (43.0h old, limit 36h)
INFO Section gsc         state=unavailable  stale (43.0h old, limit 36h)
... (every single one)
INFO Done. Sections: 0 ok, 11 unavailable. Projects: 0/7 ok.
Every collector's JSON output was 43 hours old. The orchestrator had done exactly what I told it to do. Read those JSONs, notice they were past the 36-hour threshold, and render them as "unavailable" badges. It wasn't broken. My cron pipeline was.
What Actually Went Wrong
I'd split the system into two layers, which was correct. Eleven collector scripts that fetch data and write a JSON file each. One orchestrator that reads those JSONs and renders the HTML. Clean separation, easy to test in isolation, and a new collector is just a new file in a folder.
My run.sh, the one cron was actually calling, looked like this:
#!/usr/bin/env bash
set -euo pipefail
cd "$(dirname "$0")"
uv run digest.py 2>&1 | tee -a last-run.log
See the bug? It only runs the orchestrator. It never runs the collectors.
The collector JSONs had been refreshed the previous weekend when I manually ran each one during development. Those files stuck around. For a day or two they were fresh enough to clear the staleness threshold, and the orchestrator happily assembled them into a report. I thought the pipeline was working. It wasn't. It was just coasting on stale cache.
Then Tuesday morning hit 36 hours past Sunday and the whole thing flipped at once. Eleven sections, all stale, all at once, all "unavailable". A beautifully coordinated failure.
The subtle lesson: splitting a pipeline into producer and consumer stages is only half the job. You still need something to actually invoke the producers on schedule. If the runner is only running the consumer, your consumer is just reading last week's data with a straight face.
The Dropbox Pattern
Here's the pattern that survives this kind of silliness. I didn't invent it. It's folklore that shows up under a few different names (filesystem queues, spool directories, poor-man's message bus). Whatever you call it, the shape is the same:
- Every collector is a standalone script. It takes no arguments, writes exactly one file (
collectors/<name>.json), and exits. No library imports between collectors. Nothing shared. Nothing imported. - Every JSON file has the same contract. A
statefield ("ok" or "error"), agenerated_atISO timestamp, atitle, and adatablob. That's it. The orchestrator only knows the contract, not what's indata. - The orchestrator only reads the folder. It never calls a collector. It never imports a collector. It doesn't even know their names ahead of time. It globs
collectors/*.jsonand processes whatever it finds. - Stale JSON degrades gracefully. If a file is older than N hours (I use 36), the section renders as an "unavailable" badge with the reason baked in. No crash. No missing tile. Just a visible "this is stale".
- A collector failure never takes down the report. If
github.pythrows, it writes an error JSON, or doesn't touch the file at all. The other 10 tiles still render perfectly. Worst case, one badge flips to "unavailable".
The whole point is that the pieces are decoupled in time and in space. A collector runs whenever it runs. The orchestrator renders whenever it renders. They communicate through files. If one side is broken, the other side still works.
The Collector Contract
Here's a minimal collector. This one hits GitHub via the gh CLI, but the shape is the same for any data source:
#!/usr/bin/env python3
"""GitHub collector - writes collectors/github.json"""
import json, subprocess
from datetime import datetime, timezone
from pathlib import Path

OUTPUT = Path(__file__).parent / "github.json"

def fetch():
    me = json.loads(subprocess.check_output(
        ["gh", "api", "user"], text=True
    ))
    return {
        "login": me["login"],
        "followers": me["followers"],
        "public_repos": me["public_repos"],
    }

def main():
    now = datetime.now(timezone.utc).isoformat()
    try:
        data = fetch()
        out = {
            "state": "ok",
            "title": "GitHub",
            "generated_at": now,
            "data": data,
        }
    except Exception as e:
        out = {
            "state": "error",
            "title": "GitHub",
            "generated_at": now,
            "error": str(e),
        }
    OUTPUT.write_text(json.dumps(out, indent=2))

if __name__ == "__main__":
    main()
Note what it doesn't do. It doesn't import anything from the orchestrator. It doesn't know what Jinja2 is. It doesn't care about any other collector. If this file vanishes from disk tomorrow, the other ten collectors don't notice. If GitHub's API goes down, this collector writes an error JSON and the rest of the dashboard still renders.
Every collector in my system follows this exact shape. Cloudflare Analytics GraphQL. Umami REST. Polar.sh orders. Brevo contacts. Google Search Console via google-api-python-client. A local SQLite file I keep leads in. SSH disk-usage from a handful of VPS boxes. GitHub via gh. All of them: standalone script, one JSON file, one contract, no shared state.
The Orchestrator (The Boring Part)
The orchestrator is the piece that reads the dropbox. It's maybe 150 lines of real logic, most of which is Jinja2 template setup. The interesting parts are the load function and the stale check:
STALE_HOURS = 36

def load_section(path: Path) -> dict:
    """Load a collector JSON. Never raises."""
    now = datetime.now(timezone.utc)
    base = {"name": path.stem, "state": "unavailable"}

    if not path.exists():
        base["reason"] = "no data file"
        return base

    try:
        raw = json.loads(path.read_text())
    except Exception as e:
        base["reason"] = f"invalid json: {e}"
        return base

    generated_at = datetime.fromisoformat(raw["generated_at"])
    if generated_at.tzinfo is None:
        generated_at = generated_at.replace(tzinfo=timezone.utc)
    age_hours = (now - generated_at).total_seconds() / 3600

    if age_hours > STALE_HOURS:
        base["reason"] = f"stale ({age_hours:.1f}h old)"
        return base

    if raw.get("state") != "ok":
        base["reason"] = raw.get("error", "collector error")
        return base

    return {**raw, "state": "ok", "age_hours": age_hours}
That's the whole trick. The orchestrator's default behavior is "unavailable". It only returns a successful section if the file exists, parses, is fresh, and says state: ok. Any failure along the way downgrades that section gracefully. Nothing ever throws out of this function.
The main loop is trivial:
def main():
    collector_files = sorted(COLLECTORS_DIR.glob("*.json"))
    sections = [load_section(f) for f in collector_files]

    html = template.render(
        sections=sections,
        generated_at=datetime.now(timezone.utc),
        stale_hours=STALE_HOURS,
    )
    OUTPUT.write_text(html)
    print(f"Done. {sum(1 for s in sections if s['state']=='ok')} ok, "
          f"{sum(1 for s in sections if s['state']!='ok')} unavailable.")
The template just iterates over sections and renders each one. If the state is "ok", it shows the data. If not, it shows a small muted badge with the reason. No missing tiles, no blank spots, no crashes. Jinja2 is perfect for this. One template, a handful of macros per section type, done.
The Bug, And The Two-Line Fix
With this architecture in place, my outage had one remaining cause. Nobody was actually running the collectors on schedule. Here's the fixed run.sh:
#!/usr/bin/env bash
set -euo pipefail
export PATH="/opt/homebrew/bin:/opt/homebrew/sbin:$HOME/.local/bin:/usr/local/bin:/usr/bin:/bin:$PATH"
cd "$(dirname "$0")"

# 1. Refresh each collector JSON before rendering.
#    Individual failures must NOT stop the run - the orchestrator
#    handles stale/missing JSONs gracefully.
for collector in collectors/*.py; do
    name="$(basename "$collector" .py)"
    echo "[run.sh] Refreshing collector: $name"
    python3 "$collector" || echo "[run.sh] $name failed (continuing)"
done

# 2. Render the report from whatever JSONs we have.
uv run digest.py 2>&1 | tee -a last-run.log
Why python3 for collectors and uv run for the orchestrator? Deliberate. My collectors use only the standard library (plus whatever CLI tools they shell out to), so plain python3 is enough and avoids a venv resolve on every run. The orchestrator needs Jinja2, so it goes through uv run which handles the lockfile-managed venv. If your collectors grow third-party dependencies, switch them to uv run too. The pattern doesn't care either way.
Two things worth noting. First, the || echo ... (continuing) is load-bearing. Without it, set -euo pipefail would abort the whole script the moment any single collector failed, and you'd be right back to "one broken piece takes down the report". With it, every collector gets a turn regardless of what the others do.
Second, the orchestrator runs unconditionally at the end, even if half the collectors died. That's the whole point of the dropbox pattern. The renderer always runs, and whatever data happens to be fresh on disk is what gets rendered. Half-broken is still a useful dashboard. Empty is not.
Cron and macOS: Opening the Report Automatically
The last piece is making the report actually appear in front of my face without me having to remember where it lives. On macOS, this is a one-liner at the end of digest.py:
import subprocess
subprocess.run(["open", str(OUTPUT_PATH)], check=False)
The open command on macOS pops the file in the default browser as a local file:// URL. Combined with a crontab entry:
0 8 * * * /usr/bin/env bash -lc '~/Tools/morning-digest/run.sh'...this gives me a browser tab with fresh numbers every morning at 8am without touching anything. No notification, no push, no email. Just a tab that's already open when I sit down.
If you're on Linux, xdg-open is the equivalent. If you're on WSL, wslview. If you don't want the file to auto-open (say the cron runs while you're asleep and you don't want to wake up to a hundred browser tabs), make it conditional on a --no-open flag and only call open when you run the script manually.
One gotcha on macOS. If your cron runs inside a non-login shell, it won't have Homebrew's uv, python3, or gh on PATH, and your collectors will all fail with "command not found". The bash -lc in the cron line forces a login shell, which picks up your normal PATH. Or export PATH=... explicitly at the top of run.sh like I did above.
Per-Project Grouping via Config
One more wrinkle. My collectors fetch data source by source. Cloudflare across all my zones, Umami across all my sites, GSC across all properties. But what I actually want to see in the morning is per-project. "example.com had X visitors, made $Y, got Z signups". So the orchestrator has a config that maps projects to collectors:
PROJECTS = [
    {
        "id": "example-com",
        "name": "Example.com",
        "domain": "example.com",
        "sources": {
            "cloudflare": "example.com",
            "umami": "example.com",
            "gsc": "sc-domain:example.com",
            "revenue": "example-com",
        },
    },
    # ...more projects
]
Then the template iterates over PROJECTS, and for each project it pulls the right slice out of each collector's JSON. If cloudflare.json is stale or missing, that project's Cloudflare tile shows "unavailable", but the other three tiles (Umami, GSC, Revenue) still render. The failure blast radius is one tile, not one project, and definitely not the whole dashboard.
This is the payoff for the dropbox pattern. Every tile on the dashboard is independent from every other tile. There's no central "state" that can go bad. No collector calling another collector. No shared imports, no shared exceptions, no shared HTTP session that can wedge and take down the rest. Just files on disk.
What I'd Do Differently From Day One
A few things I should have done from the start:
Put an explicit test for "is anything running the collectors" in CI. Even a dumb script that checks whether any collectors/*.json file has been written in the last 24 hours. That one check would have caught my bug within a day, not in "oh the dashboard is blank" mode.
Add a "last refreshed" footer to the dashboard itself. Mine shows section-level ages now. "updated 3h ago" or "updated 42h ago" in small muted text under each tile. You notice when something's wrong before the tile flips to "unavailable". This alone would have caught the stale-cache period and given me a day of warning.
Lean into the "unavailable" state, don't treat it as failure. My first instinct was to make the orchestrator email me when a section went unavailable. That's overkill. I open the dashboard every morning anyway. The visible "unavailable" badge is the alert. I want the report to still be useful when one collector is down, not to get paged about it.
Standardize the collector contract earlier. I wrote my first three collectors with slightly different JSON shapes, and the orchestrator had to special-case them. Taking an afternoon to normalize was worth it. Same fields, same order, same ISO timestamp format, always.
Commit collector JSONs to git, selectively. I ignore them by default, but for the interesting ones (leads, revenue) I commit a daily snapshot to a separate private repo. It gives me a free time-series of my own metrics without standing up a database. Git is a surprisingly good metrics store for data that updates once a day and has maybe 5 KB of state. When I want to read the history back, git log --follow -p collectors/revenue.json prints every daily diff as a readable patch. I've literally grepped it for "which day did MRR first cross X" more than once. It's not Grafana, but it was one command and it was free.
Should You Build One?
If you're an indie hacker or solo dev and you're tired of logging into five dashboards a day to see the same zeroes, yes. A morning dashboard is one of the highest-leverage weekend projects I've built for myself. It takes two days, it costs nothing to run, it lives entirely on your machine, and it tells you exactly what you need to know in 30 seconds.
But build it with the dropbox pattern from day one. Don't do what I did and bolt it together with tight coupling, then discover two weeks later that the whole thing is a single point of failure wearing a trenchcoat. Decouple the collectors from the renderer. Write one file per source. Tolerate stale data. Never let one broken tile blank the whole report.
The best part is that it's boring. There's no magic. It's cron, JSON files, Python, and Jinja2. Technology that was boring ten years ago and is still boring today. Which is exactly what you want for something that runs at 8am while you're still asleep.
Mine blanked out once. It won't again. Not because I'm a better engineer this week than last week. The dropbox pattern is what's doing the work. The architecture is the safety net, not my attention.